Feature

Search Console and GA4, Finally on One Timeline

Plot impressions against sessions on the same chart, then break the whole picture down by country, channel and device — without opening either tool.

ReadsSearch ConsoleGA4
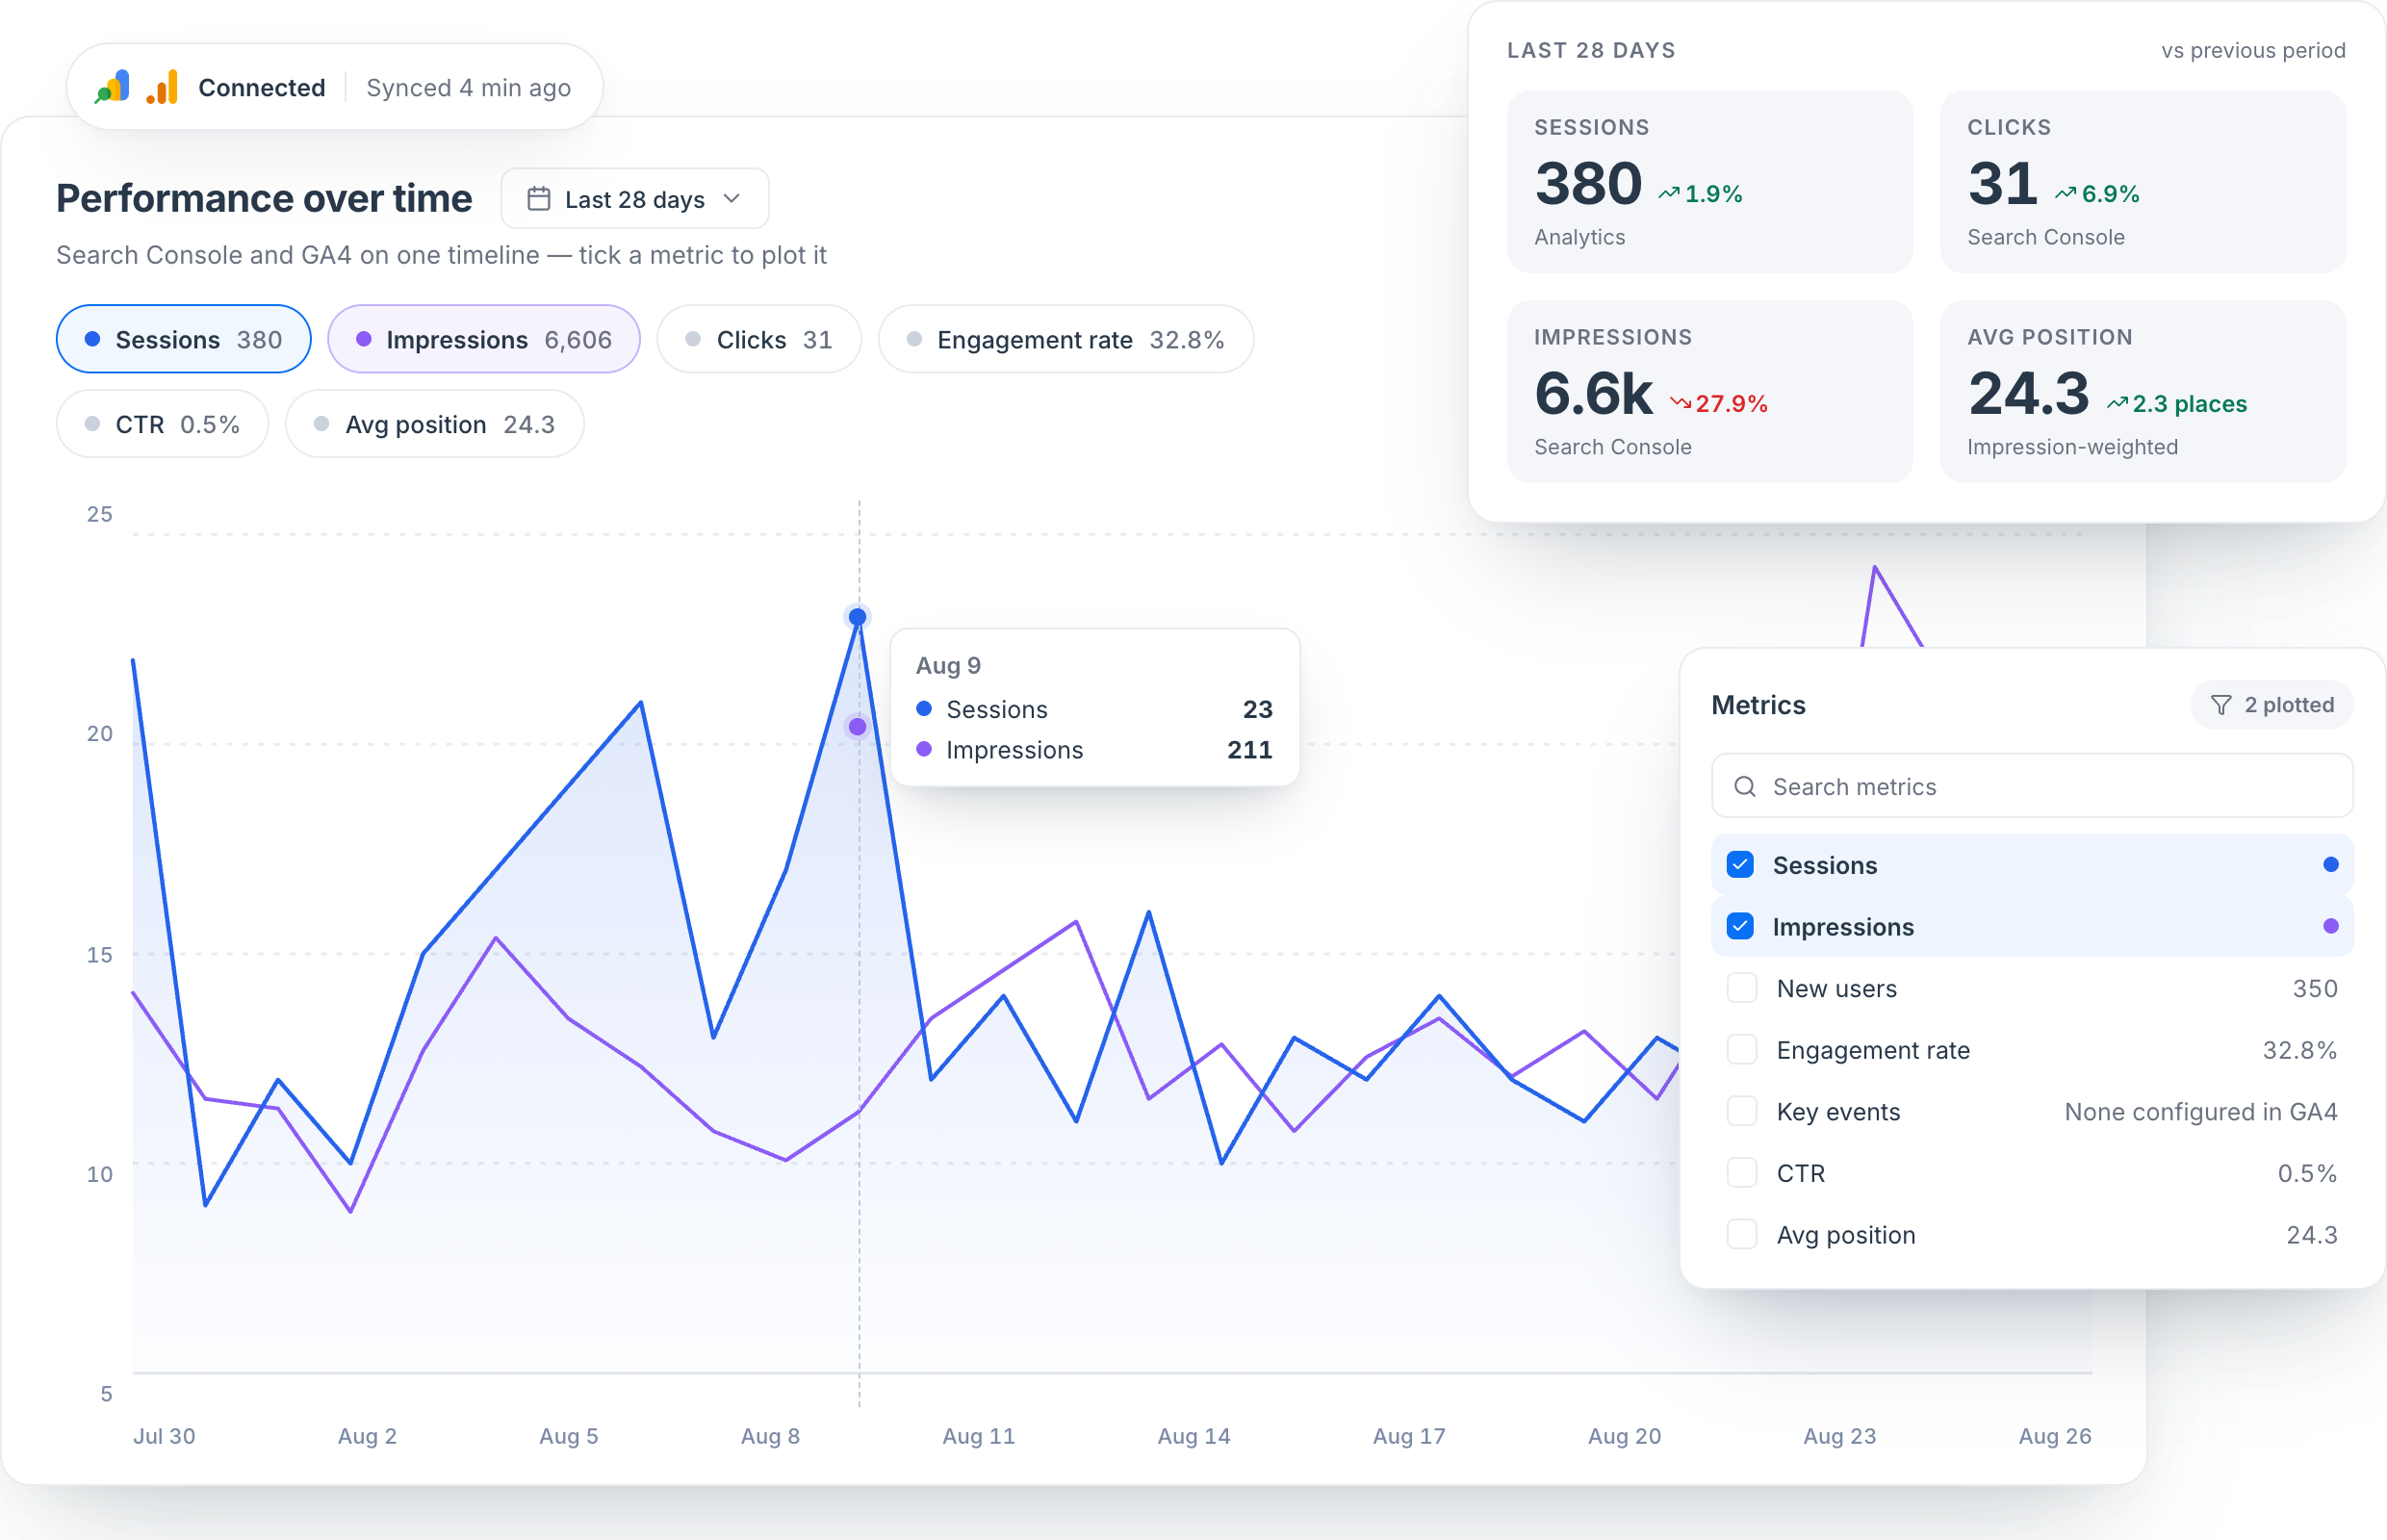
Performance over time: Search Console and GA4 on one timeline with sessions and impressions plotted together, headline tiles for sessions, clicks, impressions and average position, and a metrics panel for choosing what to plot.

What you get

Two tools' worth of data, one view

Search Console knows what happened in the results. Analytics knows what happened after the click. Neither shows you both.

One timeline, both sources

Tick any metric to plot it. Sessions from GA4 and impressions from Search Console sit on the same chart, on the same dates.

Every metric that matters

Sessions, clicks, impressions, CTR, average position, new users, engagement rate and key events — plotted or read as a total.

Labelled by source

Each headline number says whether it came from Analytics or Search Console, so nobody has to guess which tool to trust.

Country and city

A world map plus a ranked list, with search and analytics metrics together for whichever market you click.

How they got here

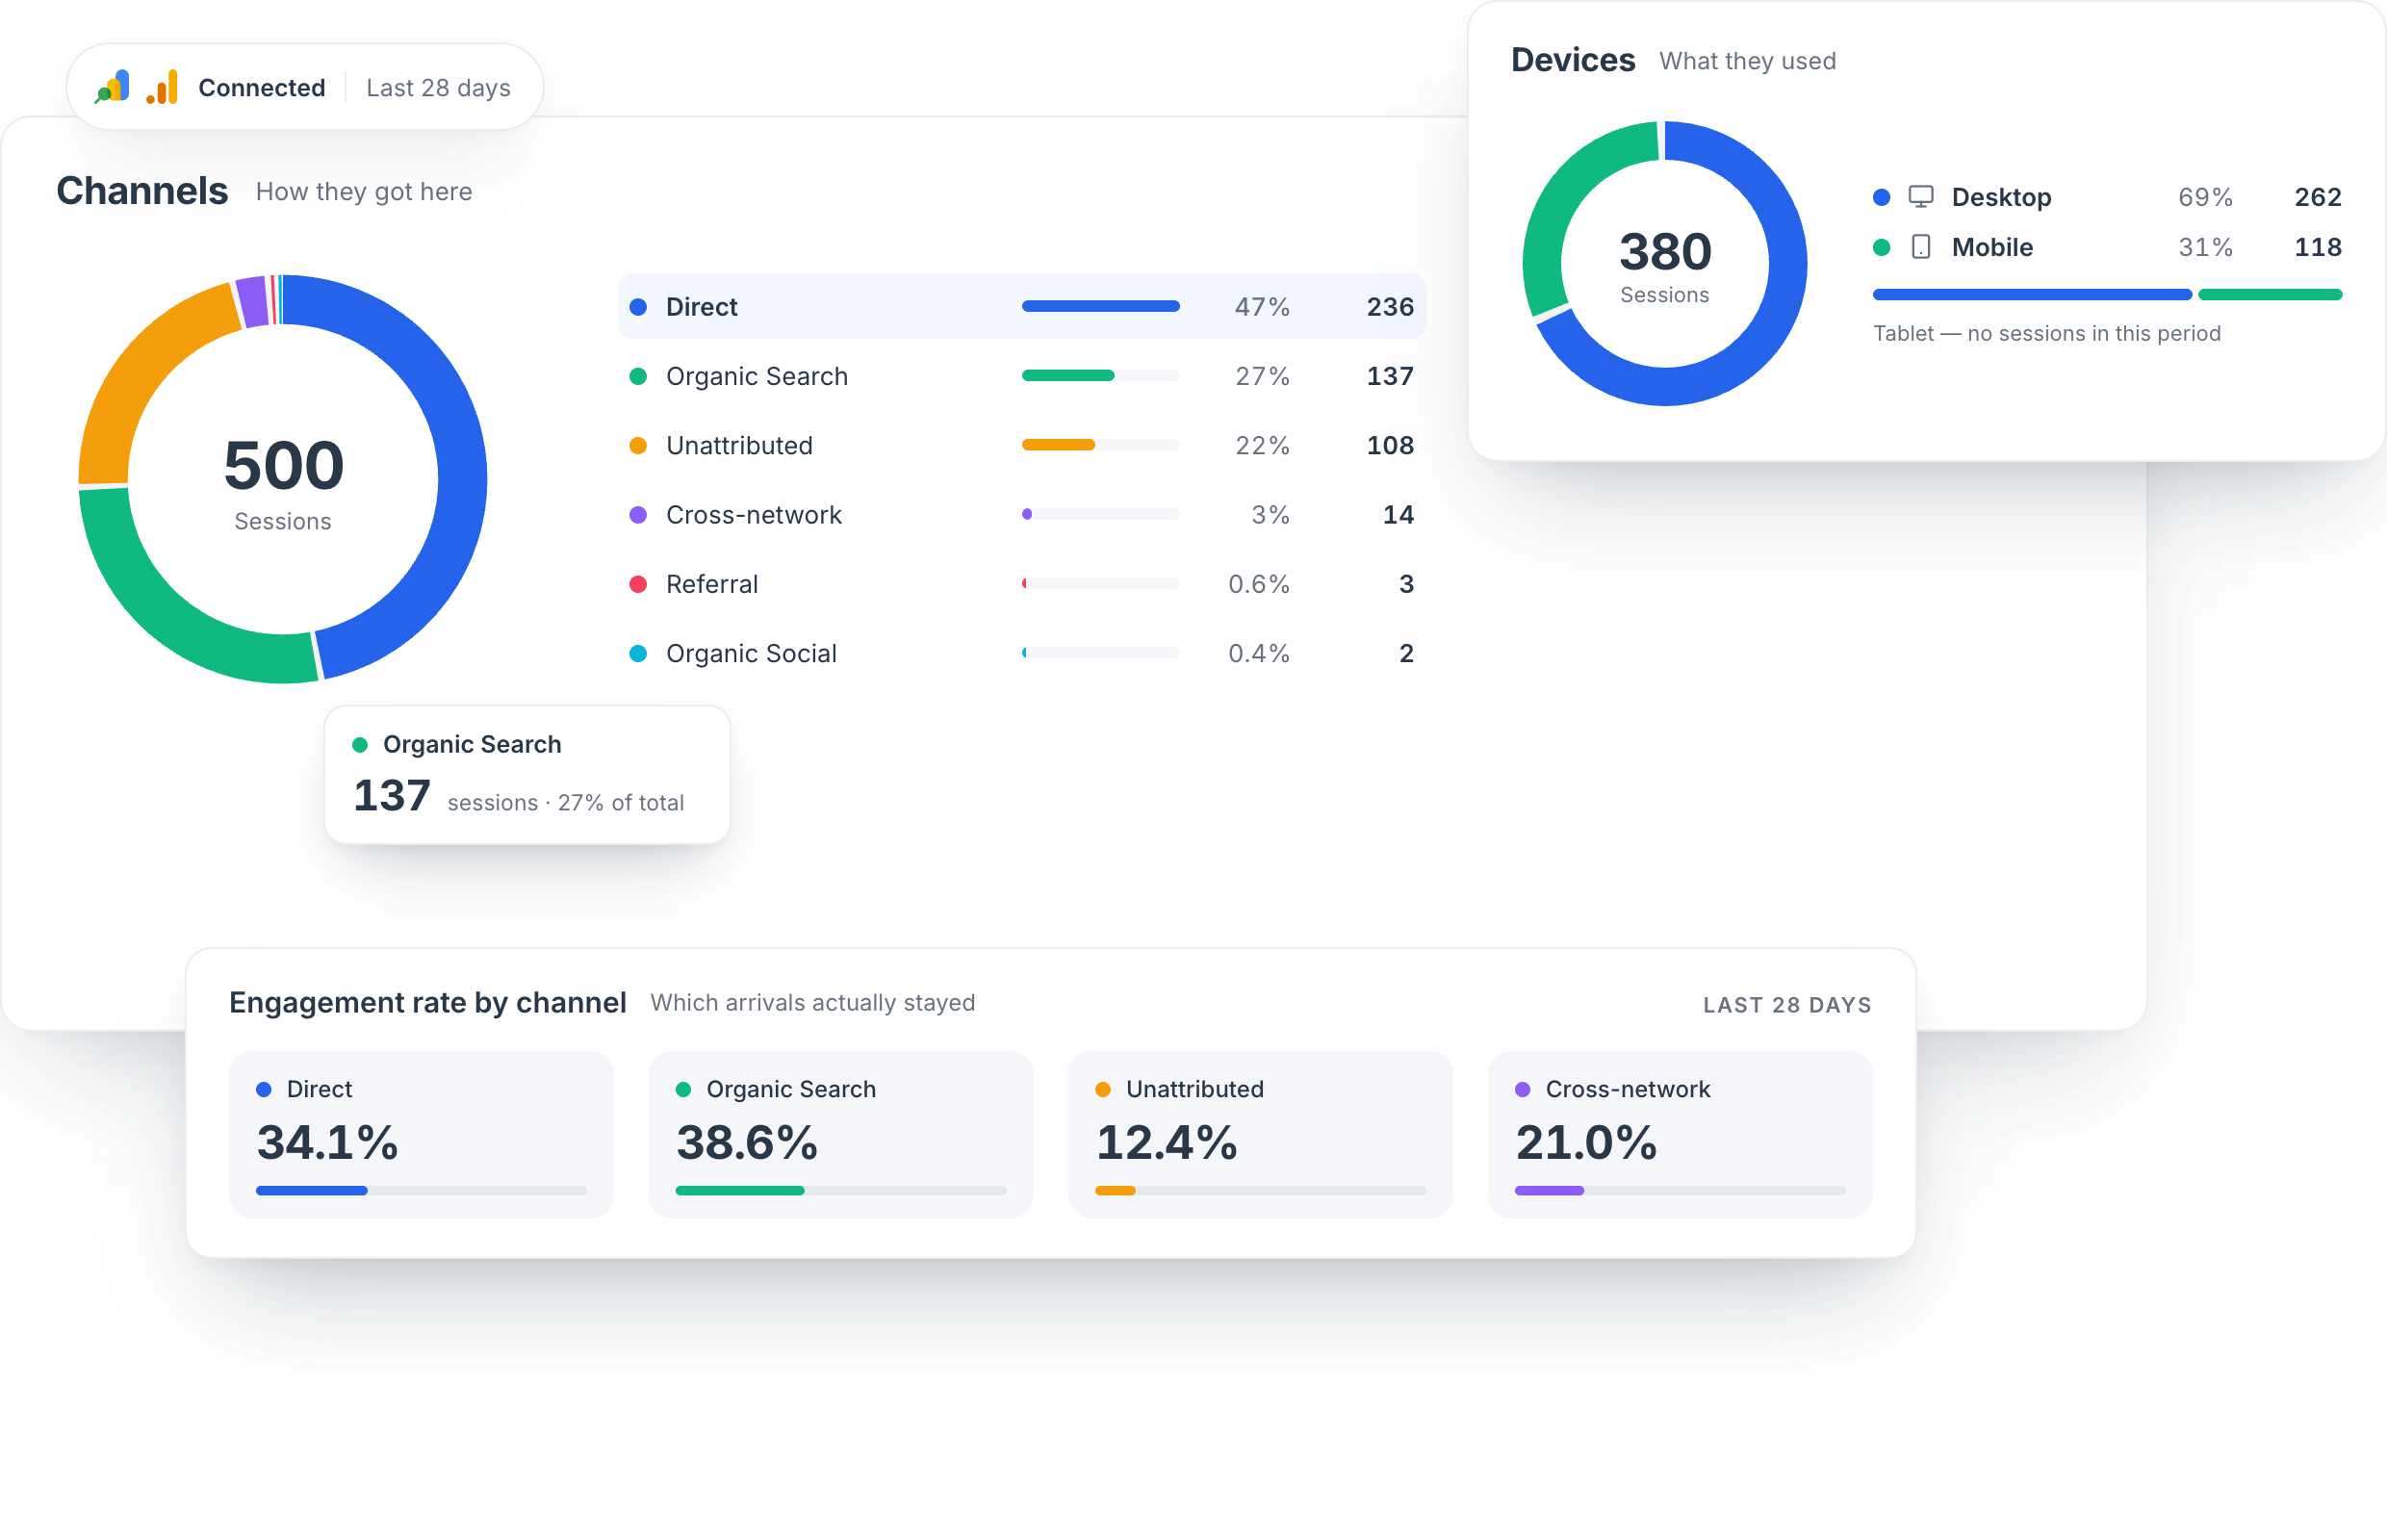
Channel split with engagement rate per channel, so you see which arrivals actually stayed — not just which were biggest.

What they used

Desktop, mobile and tablet share of sessions, stated plainly including the devices that sent nobody.

Go deeper

Then slice it until it tells you something

01Geography

Which markets are actually working

  • World map plus a ranked list of countries by sessions
  • Switch between country and city level
  • Clicks, impressions, CTR and average position per market
  • Sessions, engagement rate and new users for the same market
  • Says how many countries recorded sessions, not just the top few
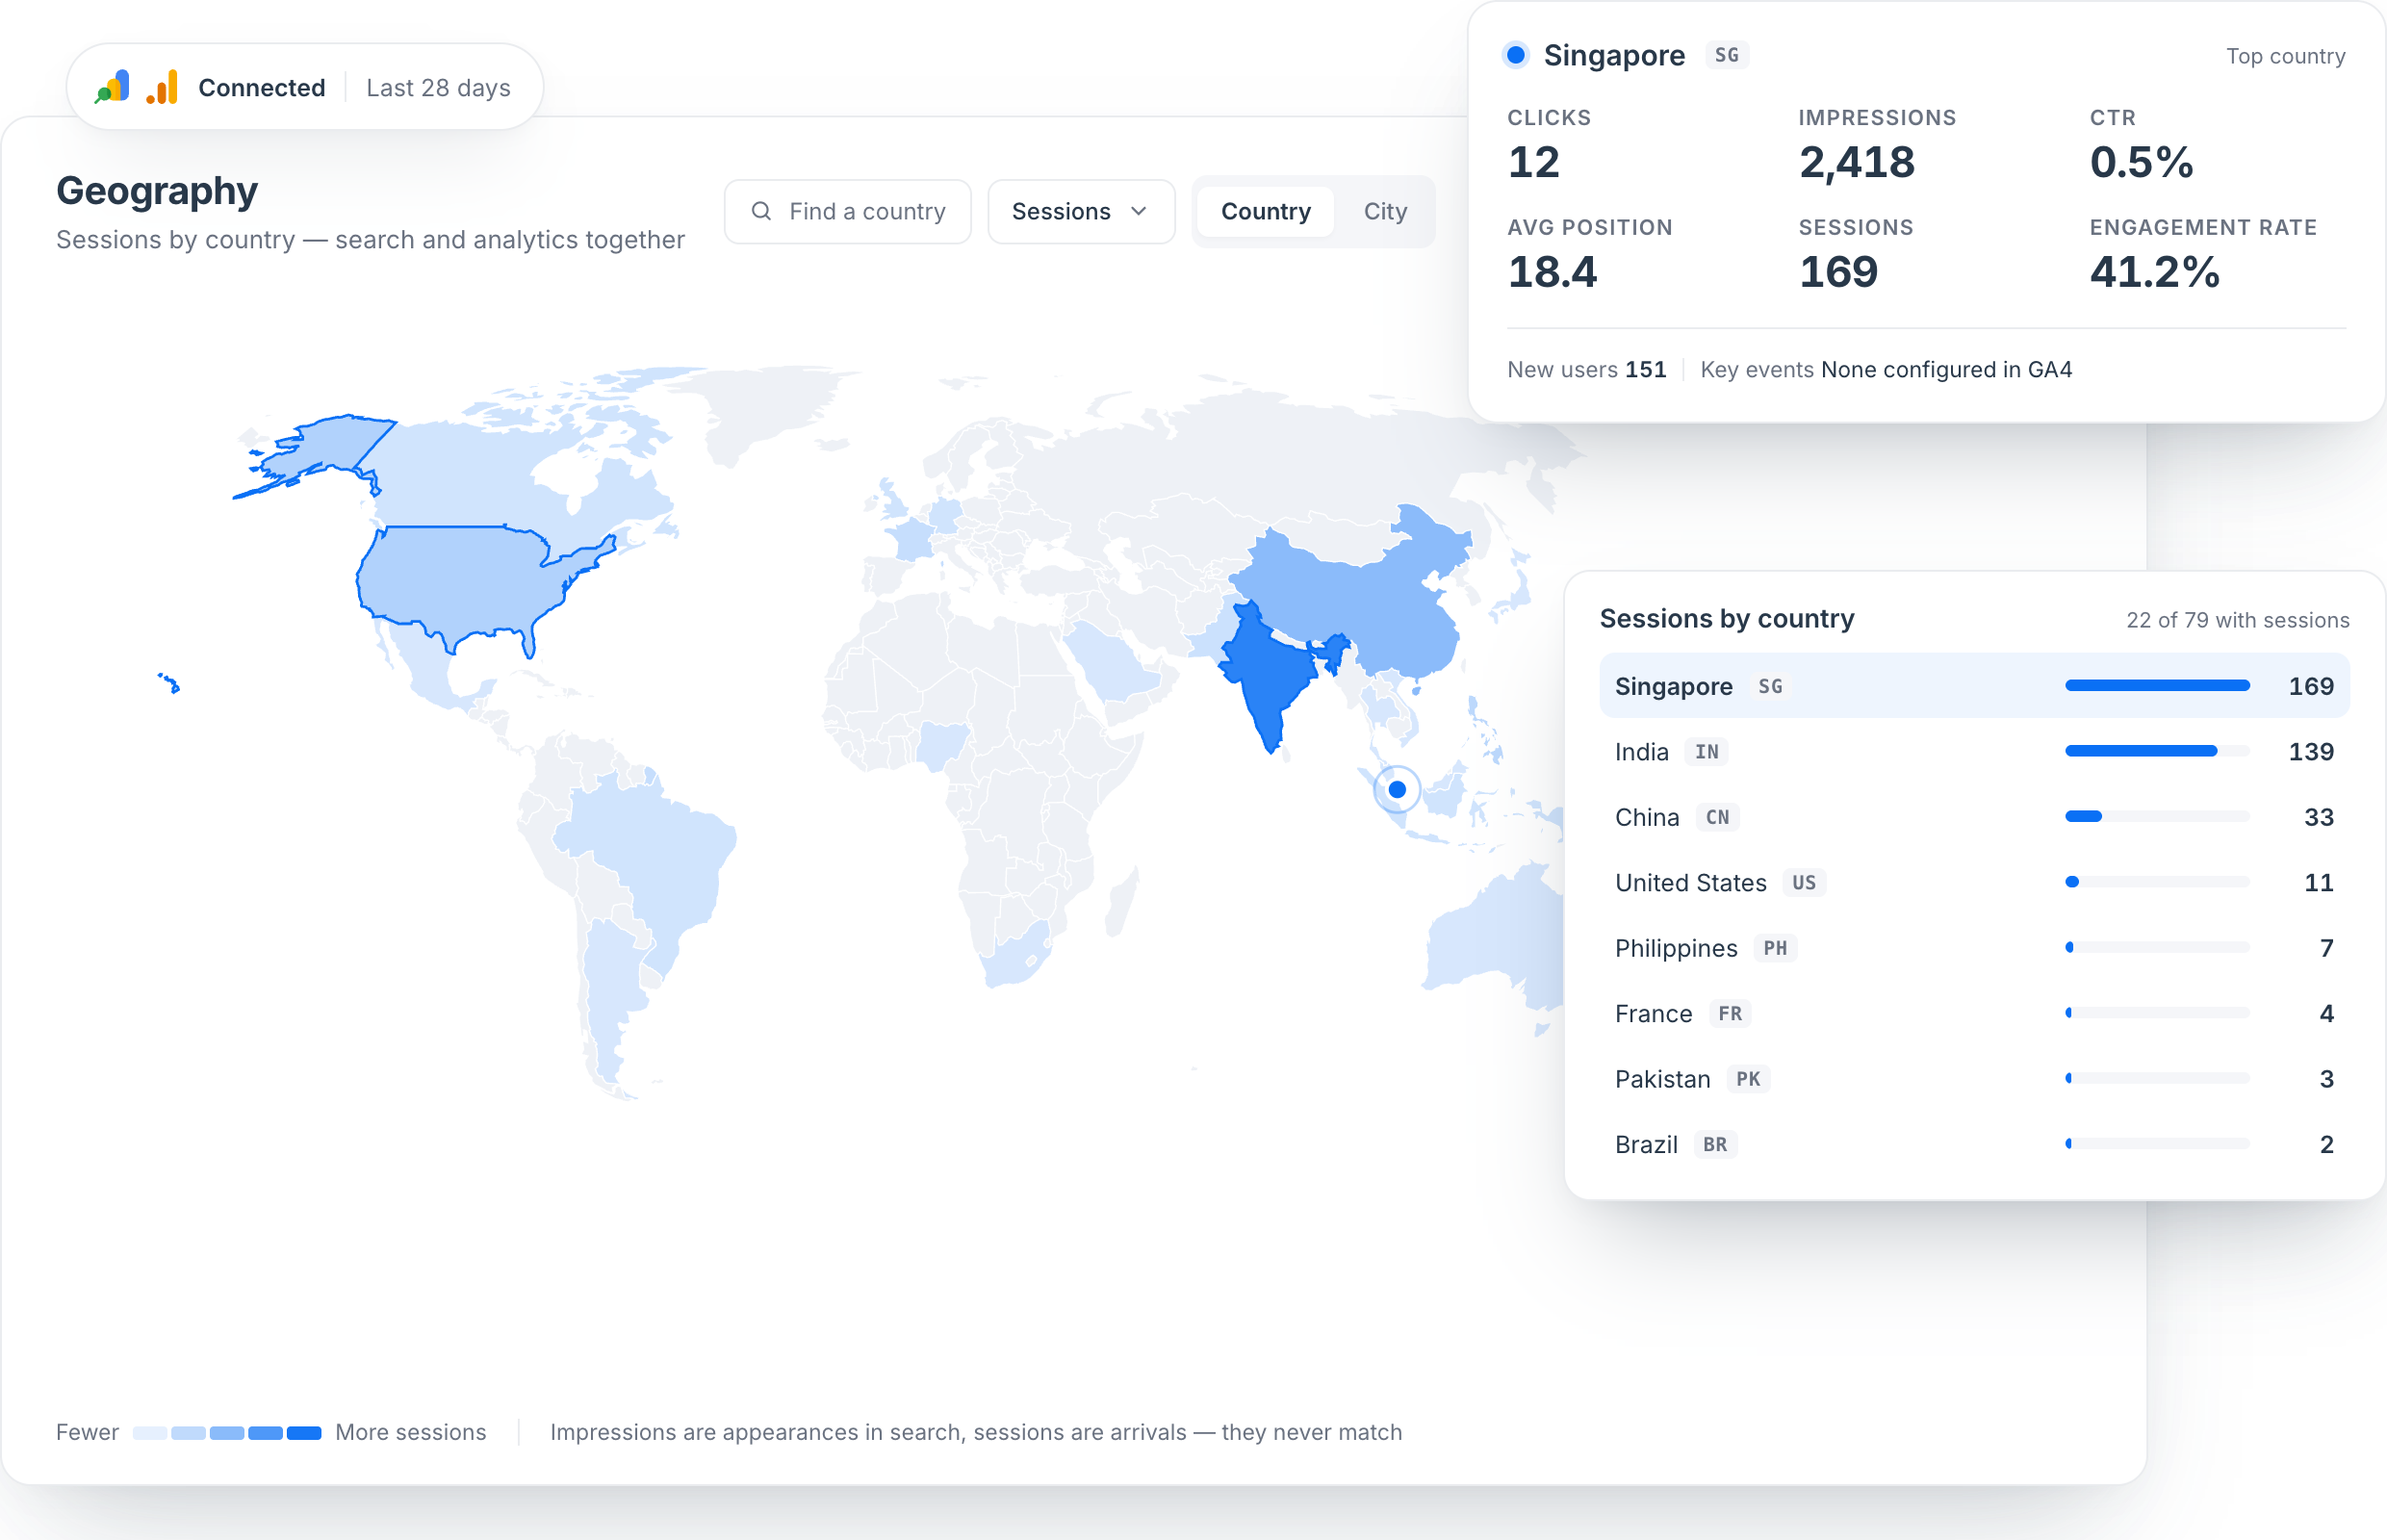
Geography view: a world map shaded by sessions, a ranked list of countries, and a card showing the top country's clicks, impressions, CTR, average position, sessions and engagement rate.

02Channels & devices

How they got here, and whether they stayed

  • Session share across direct, organic, referral, social and cross-network
  • Engagement rate per channel, so volume and quality sit side by side
  • Desktop, mobile and tablet split of sessions
  • Unattributed traffic shown as its own slice rather than buried

The biggest channel isn't always the best one. Engagement rate per channel is what separates traffic that arrived from traffic that mattered.

Channels and devices: a donut of session share by channel with a ranked list, engagement rate per channel, and a device split between desktop and mobile.

Why it's one view

One timeline, not two tabs

The hard part was never reading the numbers. It's getting them side by side.

The usual wayTwo tabs and a spreadsheet
  • Search Console in one tab, Analytics in another — you hold the comparison in your head.
  • Exports arrive as separate CSVs, lined up by hand before they can be read together.
  • The sheet is stale the day after you build it, so you build it again next month.
Source: two manual exports
Google Search ConsoleGoogle Analytics 4Easy FetcherBoth sources, already joined
  • Reads the Search Console and Analytics APIs for your own verified properties.
  • Impressions and sessions plot on one chart, over the same dates, labelled by source.
  • Syncs on a schedule with the last run in the header — there is no sheet to rebuild.
Source: Search Console + GA4 APIsRead-only

There is no tracking script to add. If Search Console and Analytics already record it, Easy Fetcher reads it through read-only OAuth — and those reads come from your own Google accounts, so they never consume AI credits.

Metrics explorer

Every GA4 and Search Console metric

325+ fields across both properties, grouped the way Google groups them. Filter by category, or search the lot.

  • Clicks
  • Impressions
  • CTR
  • Average position
  • Click-through rate change
  • Position change
  • Clicks change
  • Impressions change

Questions

SEO performance, answered

Yes — that's the point of this view. Tick any combination of metrics and they plot on one timeline over the same date range, so you can put impressions next to sessions without exporting either. Each headline number is labelled with the source it came from.

More

Other features

Stop stitching two dashboards together.

Connect Search Console and GA4 in about two minutes and read them on one timeline.

Get Started